open access DATA archive
FUNCTIONAL MULTINEURON CALCIUM IMAGING (fMCI)


fMCI is a functional imaging technique with multicell loading of calcium fluorophores, which was originally introduced by Yuste and Katz (Neuron 6:333-344, 1991). fMCI has unique advantages, including: i) recording en masse from hundreds of neurons in a wide area, ii) single-cell resolution, iii) identifiable location of neurons, and iv) detection of non-active neurons during the observation period. For details, see our method paper.


Methods

Rat slice cultures were loaded with Oregon Green 488 BAPTA-1AM, and calcium signals were optically recorded from the CA3 pyramidal cell layer in aCSF consisting of (in mM): 127 NaCl, 26 NaHCO3, 3.3 KCl, 1.24 KH2PO4, 1.0-2.0 MgSO4, 1.0-2.0 CaCl2 and 10 glucose. Fluorophores were excited at 488 nm and visualized with a 507-nm long-pass emission filter. Images were captured at 10-2000 frames/s using a Nipkow spinning-disk confocal microscope (CSU-X1; Yokogawa Electric, Tokyo, Japan), a cooled CCD camera (iXon DU897; Andor, Belfast, Northern Ireland, UK), an upright microscope (ECLIPSE FN1, Nikon, Tokyo, Japan), and a water-immersion objective (16X, 0.80 NA, CFI75LWD16xW, Nikon).


raw movie

ΔF/F movie
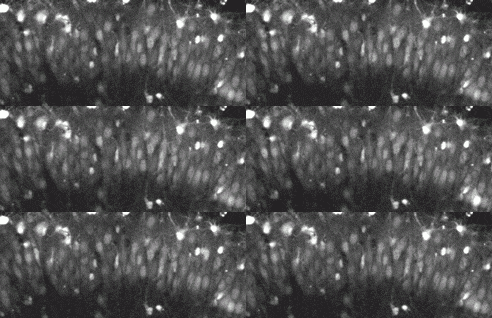
Fig. 1 Confocal movie taken from the CA3 pyramidal cell layer of a hippocampal slice incubated in Oregon Green 488 BAPTA-1AM.


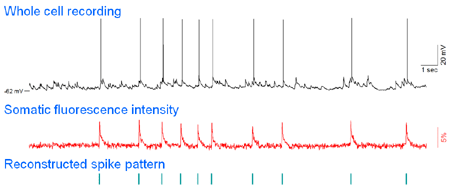
Fig. 2 Simultaneous whole-cell patch-clamp recording and calcium imaging. Action potentials (top), but not synaptc inputs, are reliably reflected in somatic calcium transients (middle), and thus, the timings of spikes can be reconstructed from the onsets of calcium transients without electrophysiologic recordings (bottom).


Data Representation

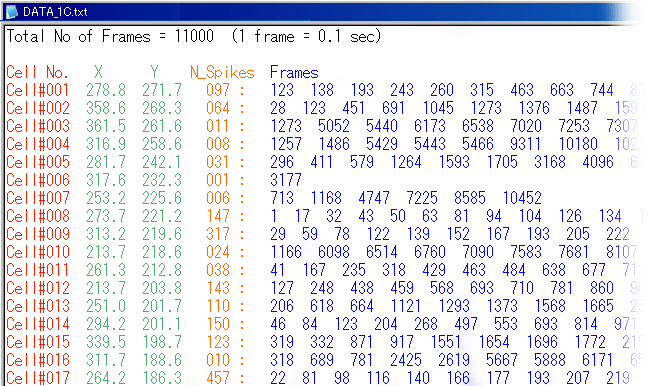
Data are given in the TEXT file format. A part of DATA_001.txt is shown below.


In this data file, the movie length is 18 min 20 sec (=11000 frames at 0.1 sec per frame). Each horizontal row in the Data part represents the data of a single cell. This file contains 62 cells (rows). The first ' red' column indicates the cell number (assigned arbitrarily). The next two 'green' columns indicate the 'X versus Y' coordinate of the cell location (unit: micrometer). The 'orange' number indicates the number of the total activity of the cell during the movie. For example, Cell1 showed 97 activities during the recording period of 18 min 20 sec. If this value is zero, the neuron was silent. The following 'blue' columns indicate individual activity times of the cell, i.e., frames at which the neuron fired. For example, Cell1 was activated at frames 123, 138, 193, 260, ..., that is, it fired at 12.3, 13.8, 19.3, 26.0, ..., sec after the beginning of the movie.

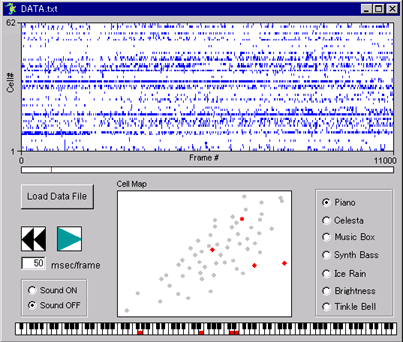
As a result, the cell map and the activity rastergram can be reconstructed from DATA_001.txt as follows.


Archive (for download, right-click on the filename)

data # movie length frame rate number of neurons region temperature
DATA_001.txt 1100 sec 10 Hz 62 hippocampal CA3 32 ºC
DATA_002.txt 700 sec 10 Hz 126 hippocampal CA3 32 ºC
DATA_003.txt 600 sec 10 Hz 226 hippocampal CA3 32 ºC
DATA_004.txt 1200 sec 10 Hz 64 hippocampal CA3 32 ºC
DATA_005.txt 610 sec 10 Hz 88 hippocampal CA3 32 ºC
DATA_006.txt 1200 sec 10 Hz 95 hippocampal CA3 32 ºC
DATA_007.txt 310 sec 10 Hz 68 hippocampal CA3 32 ºC
DATA_008.txt 1200 sec 10 Hz 93 hippocampal CA3 32 ºC

temperature dependence
DATA_009.txt 180 sec 100 Hz 169 hippocampal CA3 24 ºC
DATA_010.txt 180 sec 100 Hz 106 hippocampal CA3 24 ºC
DATA_011.txt 180 sec 100 Hz 135 hippocampal CA3 24 ºC
DATA_012.txt 180 sec 100 Hz 121 hippocampal CA3 24 ºC
DATA_013.txt 180 sec 100 Hz 120 hippocampal CA3 24 ºC
DATA_014.txt 180 sec 100 Hz 156 hippocampal CA3 28 ºC
DATA_015.txt 180 sec 100 Hz 105 hippocampal CA3 28 ºC
DATA_016.txt 180 sec 100 Hz 134 hippocampal CA3 28 ºC
DATA_017.txt 180 sec 100 Hz 112 hippocampal CA3 28 ºC
DATA_018.txt 180 sec 100 Hz 134 hippocampal CA3 28 ºC
DATA_019.txt 180 sec 100 Hz 127 hippocampal CA3 32 ºC
DATA_020.txt 180 sec 100 Hz 179 hippocampal CA3 32 ºC
DATA_021.txt 180 sec 100 Hz 150 hippocampal CA3 32 ºC
DATA_022.txt 180 sec 100 Hz 125 hippocampal CA3 32 ºC
DATA_023.txt 180 sec 100 Hz 135 hippocampal CA3 32 ºC
DATA_024.txt 180 sec 100 Hz 105 hippocampal CA3 36 ºC
DATA_025.txt 180 sec 100 Hz 157 hippocampal CA3 36 ºC
DATA_026.txt 180 sec 100 Hz 137 hippocampal CA3 36 ºC
DATA_027.txt 180 sec 100 Hz 120 hippocampal CA3 36 ºC
DATA_028.txt 180 sec 100 Hz 152 hippocampal CA3 36 ºC
DATA_029.txt 180 sec 100 Hz 129 hippocampal CA3 40 ºC
DATA_030.txt 180 sec 100 Hz 106 hippocampal CA3 40 ºC
DATA_031.txt 180 sec 100 Hz 187 hippocampal CA3 40 ºC
DATA_032.txt 180 sec 100 Hz 160 hippocampal CA3 40 ºC
DATA_033.txt 180 sec 100 Hz 161 hippocampal CA3 40 ºC
DATA_034.txt 180 sec 200 Hz 74 hippocampal CA3 32 ºC

fast scanning
DATA_035.txt 130 sec 500 Hz 60 hippocampal CA3 32 ºC
DATA_036.txt 130 sec 500 Hz 88 hippocampal CA3 32 ºC
DATA_037.txt 130 sec 500 Hz 88 hippocampal CA3 32 ºC
DATA_038.txt 130 sec 500 Hz 64 hippocampal CA3 32 ºC
DATA_039.txt 130 sec 500 Hz 96 hippocampal CA3 32 ºC
DATA_040.txt 130 sec 500 Hz 137 hippocampal CA3 32 ºC
DATA_041.txt 130 sec 500 Hz 87 hippocampal CA3 32 ºC
DATA_042.txt 130 sec 500 Hz 95 hippocampal CA3 32 ºC
DATA_043.txt 130 sec 500 Hz 85 hippocampal CA3 32 ºC
DATA_044.txt 130 sec 500 Hz 131 hippocampal CA3 32 ºC
DATA_045.txt 130 sec 500 Hz 77 hippocampal CA3 32 ºC
DATA_046.txt 130 sec 500 Hz 53 hippocampal CA3 32 ºC
DATA_047.txt 130 sec 500 Hz 72 hippocampal CA3 32 ºC
DATA_048.txt 130 sec 500 Hz 60 hippocampal CA3 32 ºC

long-time movie
DATA_049.txt 3300 sec 10 Hz 140 hippocampal CA3 32 ºC

To confirm whether you correctly reconstructed spike trains from these data, the Visual Basic program Raster_Reconstractor.exe (76 kb) may be useful (see below). Because this program is written in Visual Basic 6.0 for Microsoft Windows PCs, VB6 runtime is required to run it. The runtime is distributed at Microsoft Download Center (free).


References

Ikegaya, Y., Aaron, G., Cossart, R., Aronov, D., Lampl, I., Ferster, D., and Yuste, R. Synfire chains and cortical songs: Temporal modules of cortical activity. Science, 304:559-564, 2004.

Sasaki, T., Matsuki, N., Ikegaya, Y. Metastability of active CA3 networks. J. Neurosci., 27:517-528, 2007.

Takahashi, N., Sasaki, T., Matsumoto, W., Matsuki, N. and Ikegaya, Y. Circuit topology for synchronizing neurons in spontaneously active networks.Proc. Natl. Acad. Sci. U. S. A., 107:10244-10249, 2010.


Review

Takahashi, N., Sasaki, T., Usami, A., Matsuki, N., Ikegaya, Y. Watching neuronal circuit dynamics through functional multineuron calcium imaging (fMCI). Neurosci. Res., 58:219-225, 2007. (PDF)


Protocol

Takahashi, N., Oba, S., Yukinawa, N., Ujita, S., Mizunuma, M., Matsuki, N., Ishii, S. and Ikegaya, Y. High-speed multineuron calcium imaging using Nipkow-type confocal microscopy. Curr. Protoc. Neurosci., 2:Unit2.14, 2011.
(PDF)


Note

Although these files are freely available for analysis, we still own the copyright of the original (not analyzed) data and may claim coauthorship when the analyzed data are published elsewhere. The contact informasion is:

Yuji IKEGAYA
Laboratory of Chemical Pharmacology,
Graduate School of Pharmaceutical Sciences,
The University of Tokyo.
7-3-1 Hongo, Bunkyo-ku, Tokyo 113-0033, Japan.
TEL: 03-5841-4780, FAX: 03-5841-4786
yuji@ikegaya.jp